Power BI
How To Create And Upload Images Or Icons For Your Power BI Workspaces
By knowing the right steps to create icons, you can personalize and make your workspaces unique to your organization.
In this blog, we will show you how to customize the look and feel of your Power BI button to be consistent with your brand.
Buttons in Power BI are an important tool for reports and dashboards.
Below in Image 1, we have two buttons. The information button is from the standard “Icon types” as shown in Image 2. The book icon is inserted through the “Custom” icon type. There are a few extra steps associated with a custom icon.
Image 1: Example button icons in a report

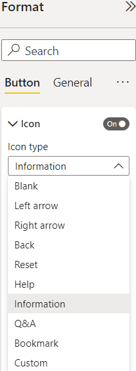
Image 2: Standard Icon button types
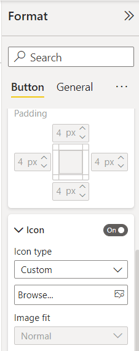
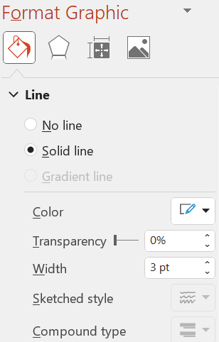
The method for inserting a custom button icon is not completely intuitive and will now be explained. On the top of the Power BI Desktop ribbon, select Insert->Button. Pick any of the default buttons available. Make sure to select the new button and move it to a desirable place on the report page. Go to the format pane-> Style->Icon. For Icon type, pick “Custom”. Then, browse to find the file for the icon image you wish to use for the button, which was previously saved off as a .png or .jpeg file. The icon images can be modified in Power Point to get the correct color and line width. The Power Point format graphic parameters for obtaining a transparent background with the icon-colored white are displayed in Image 3.
Image 3: Format Button in PBI and Icon Format Graphics in Power Point
This is how easy it is to customize the look and feel of your Power BI button to be consistent with your brand and add the needed design that will complete your reports.
By knowing the right steps to create icons, you can personalize and make your workspaces unique to your organization.
Icons in Power BI can add that extra professional touch to your report or dashboard and put them in a class of their own. Here are 3 free sources...
Branding Power BI Reports is very helpful to both your consumers and fellow authors. Here are 3 tips to help you brand your reports successfully.